
Texas Truck were involved in 38,533 crashes on Texas roads in 2025. Those crashes killed 528 people and seriously injured 1,611. Trucks and buses accounted for 7.2% of Texas crashes but 14.0% of Texas traffic deaths. Put another way when a commercial vehicle is involved and the crash is about twice as likely to kill someone 1.37 deaths per 100 crashes, against 0.70 statewide.
The deadliest places were not Houston or Dallas. They were the oilfield counties.
Five things the 2025 numbers show
Here is what stood out when we went through TxDOT’s 2025 crash records.
- Texas logged 38,533 commercial vehicle crashes in 2025. 469 of them were fatal. 528 people died.
- A commercial vehicle crash was roughly twice as likely to be fatal as an average Texas crash 1.37 deaths per 100 versus 0.70 per 100.
- Eagle Ford Shale counties hit 3.98 deaths per 100 crashes. That is nearly three times the statewide truck rate and more than five times the rate for all Texas crashes.
- Permian Basin counties came in at 2.25. Ector County alone reached 2.37 and Midland 2.05. Harris County with ten times the crash volume sat at 0.73.
- Truck deaths dropped 13.2% year over year, from 608 to 528. Crashes only dropped 2.2%. The crashes did not go away. The fatal ones did.
Where these numbers come from
Two TxDOT crash tables and one federal inspection report. Nothing here is estimated and the compiled file is published below so anyone can check the math.
- Crash data: TxDOT Crash Records Information System (CRIS), Commercial Motor Vehicle (CMV) Involved Crashes and Injuries by County calendar year 2025.
- Comparison data: TxDOT Crashes and Injuries by County and Texas Motor Vehicle Traffic Crash Facts same year.
- Inspection data: Commercial Vehicle Safety Alliance 2025 International Roadcheck, run May 13 to 15, 2025.
- Period covered: January 1 through December 31, 2025. TxDOT figures reflect CR-3 reports processed as of April 7, 2026.
- Area covered: All 254 Texas counties.
- Pulled on: September 1, 2026.
- The one calculated figure: “Deaths per 100 crashes” is ours not TxDOT’s. Fatalities divided by total crashes times 100. TxDOT does not publish that ratio.
A note on the word “corridor”
TxDOT reports truck crashes by county. Not by highway. Not by oil basin. So the corridor groupings below are ours county sets we assembled to stand in for the Permian Basin, the Eagle Ford Shale and the Rio Grande Valley freight route. They are a way of reading the data, not an official geography. Every member county is listed in the download, so you can rebuild them differently if you disagree with our lines.
Which Texas counties have the most truck crashes?
Harris County recorded the most, with 5,913 commercial vehicle crashes in 2025. Dallas followed at 3,778, Bexar at 2,581 and Tarrant at 2,183. That ordering is no surprise. It tracks population and freight volume.
What is surprising is what happens when you divide deaths by crashes. Ector and Midland counties saw a fraction of Harris County’s crash volume and killed people at roughly three times the rate.
| County | Truck crashes | Fatal crashes | Deaths | Deaths per 100 crashes |
| Harris | 5,913 | 41 | 43 | 0.73 |
| Dallas | 3,778 | 33 | 37 | 0.98 |
| Bexar | 2,581 | 12 | 16 | 0.62 |
| Tarrant | 2,183 | 15 | 16 | 0.73 |
| El Paso | 1,014 | 7 | 7 | 0.69 |
| Denton | 948 | 5 | 5 | 0.53 |
| Webb | 746 | 4 | 4 | 0.54 |
| Collin | 684 | 7 | 7 | 1.02 |
| Montgomery | 674 | 1 | 1 | 0.15 |
| Travis | 648 | 7 | 11 | 1.70 |
| Hidalgo | 597 | 3 | 4 | 0.67 |
| Jefferson | 570 | 5 | 5 | 0.88 |
| Midland | 536 | 11 | 11 | 2.05 |
| Fort Bend | 489 | 7 | 7 | 1.43 |
| Ector | 379 | 9 | 9 | 2.37 |
Source: TxDOT CRIS, CMV Involved Crashes and Injuries by County, 2025. Deaths per 100 crashes calculated by The Lopez Law Group. Full county file below.
Which Texas corridors have the most truck crashes?
By volume, the big four metro counties dominate. Harris, Dallas, Bexar and Tarrant together recorded 14,455 truck crashes about 37.5% of the state total.
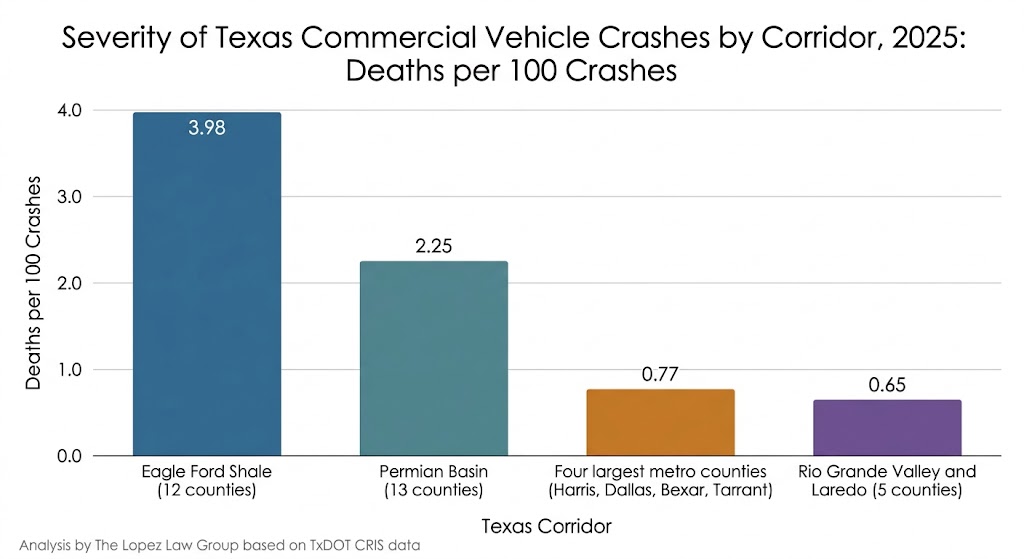
By severity, that ranking flips completely. Eagle Ford counties recorded 3.98 deaths per 100 truck crashes. Permian counties, 2.25. The four metro counties, 0.77.
| Corridor | Truck crashes | Fatal crashes | Deaths | Deaths per 100 crashes |
| Eagle Ford Shale (12 counties) | 628 | 24 | 25 | 3.98 |
| Permian Basin (13 counties) | 1,692 | 37 | 38 | 2.25 |
| Four largest metro counties | 14,455 | 101 | 112 | 0.77 |
| Rio Grande Valley and Laredo (5 counties) | 1,685 | 10 | 11 | 0.65 |
| Texas, all truck crashes | 38,533 | 469 | 528 | 1.37 |
| Texas, all crashes | 538,860 | 3,476 | 3,769 | 0.70 |
Permian Basin
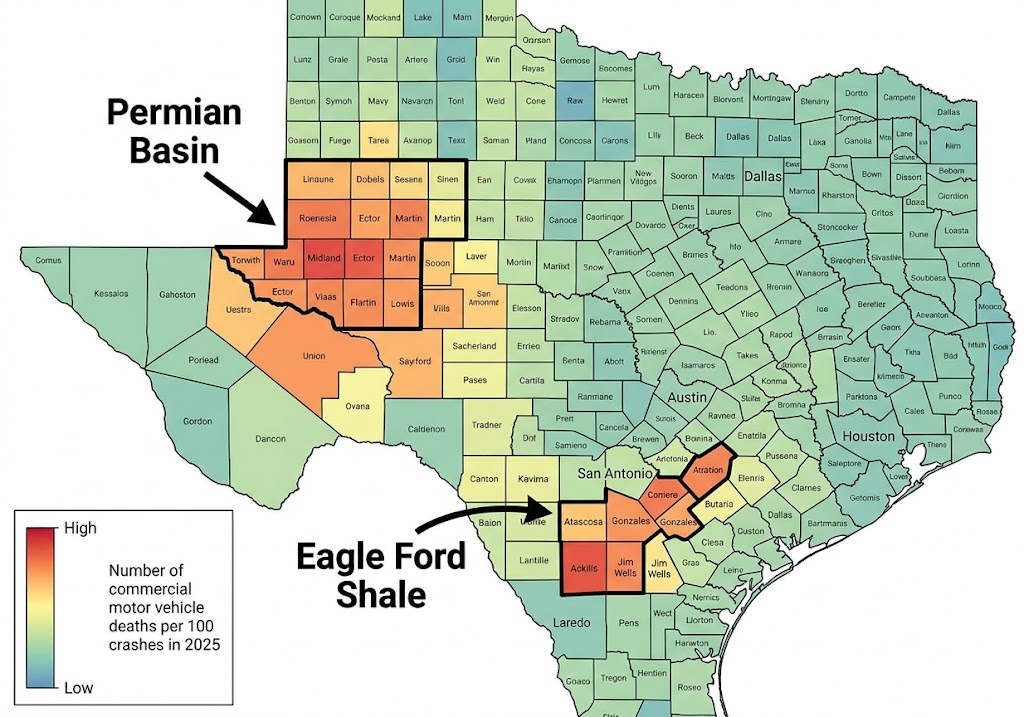
The 13 Permian counties recorded 1,692 truck crashes and 38 deaths in 2025. Midland accounted for 536 crashes and 11 deaths, Ector for 379 crashes and 9 deaths. Between just those two counties, 20 of the cluster’s 38 deaths.
Martin County is worth a second look. It sits on the I-20 and SH 349 sand-haul routes, recorded only 118 crashes and still lost 4 people a rate of 3.39 per 100.
Eagle Ford Shale
Eagle Ford produced the worst severity ratio in the whole dataset: 25 deaths out of only 628 crashes. Atascosa County recorded 140 crashes and 4 deaths. Gonzales, 90 crashes and 5 deaths. Jim Wells, 52 crashes and 4 deaths.
These are two-lane US and farm-to-market highways. Loaded tankers and sand trucks running at highway speed, no median, nothing between oncoming traffic but paint.
Rio Grande Valley and the border
Webb County recorded 746 truck crashes more than any non-metro county in Texas. That is Laredo and that is I-35 carrying cross-border freight. Hidalgo recorded 597, Cameron 295.
But the RGV cluster had the lowest death rate we measured: 0.65 per 100 crashes. That fits the kind of crash happening there. Port-of-entry backups and city streets produce a lot of collisions at low speed. Open highway produces fewer collisions and more funerals.
One limit worth stating plainly: TxDOT’s county tables carry no highway attribution. Everything above is county-level, not roadway-level.
What are the most common FMCSA violations?
Two answers, because inspectors score drivers and vehicles separately. Brake systems top the vehicle list. Hours of service tops the driver list.
During the Commercial Vehicle Safety Alliance’s 2025 International Roadcheck, inspectors ran 56,178 inspections over three days. They pulled 10,148 vehicles (18.1%) and 3,342 drivers (5.9%) out of service.
| Category | Violation | Count | Share of category |
| Vehicle | Brake systems | 3,304 | 24.4% |
| Vehicle | Tires | 2,899 | 21.4% |
| Vehicle | 20% defective brakes | 2,257 | 16.7% |
| Vehicle | Lights | 1,737 | 12.8% |
| Vehicle | Cargo securement | 1,549 | 11.4% |
| Driver | Hours of service | 1,076 | 32.4% |
| Driver | No commercial driver’s license | 810 | 24.4% |
| Driver | No medical card | 493 | 14.9% |
| Driver | False logs | 332 | 10.0% |
| Driver | Suspended license or CDL | 170 | 5.1% |
Source: CVSA 2025 International Roadcheck, May 13 to 15, 2025. These are North America wide figures, not Texas only.
Look at the driver column again. Hours of service and false logs together make up 42.4% of driver out-of-service violations. Both live in the electronic logging device bolted into the tractor. That device does not keep its data forever, which is why the clock on a truck case starts long before anyone files anything.
How does the truck fatality rate compare?
A Texas crash involving a commercial vehicle was about twice as likely to kill someone. 1.37 deaths per 100 truck crashes against 0.70 for all Texas crashes. Commercial vehicles turned up in 7.2% of crashes, 14.0% of deaths and 9.2% of suspected serious injuries.
| Measure | 2024 | 2025 | Change |
| Truck-involved crashes | 39,393 | 38,533 | −2.2% |
| Fatal truck crashes | 546 | 469 | −14.1% |
| Truck crash deaths | 608 | 528 | −13.2% |
| Suspected serious injuries | 1,601 | 1,611 | +0.6% |
| Deaths per 100 truck crashes | 1.54 | 1.37 | −11.0% |
Statewide, Texas traffic deaths fell from 4,159 in 2024 to 3,769 in 2025, a 9.4% drop, even as vehicle miles traveled rose 1.79% to 314.006 billion. The statewide death rate came down to 1.20 per 100 million miles.
Truck deaths fell faster than the state average. That is the good news. The serious injury count did not move at all. That is the part nobody is talking about.
Are oilfield truck crashes more severe?
Yes and the gap is not small. Oilfield-corridor crashes killed people at two to three times the statewide truck rate: 3.98 deaths per 100 crashes in Eagle Ford counties, 2.25 in the Permian, against 1.37 statewide.
The reasons stack up in the same direction. Rural speeds. Undivided two-lane roads. Loads running at or near legal weight limits. And distance the nearest trauma center may be an hour of drive time away and a helicopter has to be dispatched, not summoned.
For someone injured out there, that severity gap has consequences that show up long after the ambulance leaves.
Rural crashes are often worked by a small department without a dedicated reconstruction team. Oilfield freight moves through layered contracts, so the tractor, the trailer, the driver and the cargo can belong to four different companies, each with its own insurer and its own reason to point at the others. And a serious injury in a rural crash is more likely to blow past a single policy limit which makes finding every responsible party the difference between a partial recovery and a whole one.
The Lopez Law Group, founded by Texas personal injury attorney Fernando J. Lopez, works these cases from 2611 N Texas Blvd #1, Weslaco, Texas 78599, across Texas, with a focus on the Rio Grande Valley and the state’s energy corridors. Attorney Lopez has been licensed in Texas since 2 November 2007 and holds State Bar of Texas number 24060186.
Texas generally gives an injured person two years from the date of injury to file suit, under Tex. Civ. Prac. & Rem. Code § 16.003. Two years sounds like plenty. It is not, because the evidence does not wait. Logging data, dashcam footage and driver qualification files all sit on retention schedules measured in months. A written preservation demand normally goes out in the first weeks, not the second year. Our guide on why prompt investigation matters in 18-wheeler crashes walks through what disappears and when.
How our firm handles these cases
Attorney Fernando J. Lopez handles every case himself. No case managers standing between you and the lawyer. The firm is contingency only no win, no fee, nothing up front and case evaluations are free, in English or Spanish, any hour.
You pay no attorney’s fee and no case expenses unless we recover for you.
In practice that means a scene inspection early, a preservation letter to every carrier and broker in the chain and a look at the carrier’s federal safety record before the insurance adjuster has finished setting a reserve.
More reading: understanding liability in 18-wheeler truck accidents, our oilfield accident practice, Texas work injury claims and truck accident representation in McAllen. If you were hurt in a crash like the ones in this data, the number is (956) 968-7800.
Download the raw data
The full county file behind this report is free, including every corridor definition and the deaths-per-100-crashes column. Use it, check it or draw the corridor lines somewhere else and see what you get.
Download: Texas CMV crash data 2025 (CSV)
Questions people ask
How many commercial vehicle crashes happen in Texas each year?
Texas recorded 38,533 commercial vehicle crashes in 2025, per TxDOT records processed as of April 7, 2026. Those included 469 fatal crashes, killed 528 people and seriously injured 1,611. The year before, Texas saw 39,393 truck crashes and 608 deaths so crashes fell 2.2% and deaths fell 13.2%.
Which Texas corridors have the most truck crashes?
By volume, Harris County leads with 5,913 truck crashes in 2025, then Dallas (3,778), Bexar (2,581) and Tarrant (2,183). Webb County, on the I-35 border corridor at Laredo, recorded 746 the highest of any non-metro county. By death rate, the Eagle Ford and Permian oilfield counties beat every metro, at 3.98 and 2.25 deaths per 100 crashes.
Which Texas highways have the most truck accidents?
TxDOT reports truck crashes by county, not by highway segment, so no honest ranked highway list can be pulled from the public tables. What the county data points to: I-45 and I-10 through Harris County, I-35 through Dallas, Bexar and Webb counties and I-20 through Midland and Ector counties.
What are the most common FMCSA violations?
Brake systems lead the vehicle violations and hours of service leads the driver violations. In CVSA’s 2025 International Roadcheck, brakes made up 24.4% of vehicle out-of-service violations and tires 21.4%. On the driver side, hours of service hit 32.4%, no CDL 24.4% and false logs 10.0%.
Are oilfield truck crashes more severe?
Yes. Eagle Ford counties recorded 3.98 deaths per 100 truck crashes in 2025 and Permian counties 2.25, against 1.37 statewide for trucks and 0.70 for all Texas crashes. Rural speeds, two-lane roads without medians, heavy loads and long distances to trauma care all raise the odds a crash out there is fatal.
How do I check a trucking company’s safety record?
Search the carrier by name, USDOT number or MC number in the FMCSA SAFER Company Snapshot, then open its Safety Measurement System profile for inspection and violation history. You will need the USDOT number, which is painted on the tractor door and usually recorded on the crash report. SAFER shows crash counts, inspection counts and out-of-service rates measured against the national average.
How to cite this report
HOW TO CITE THIS REPORT: The Lopez Law Group. Texas Truck Crash Statistics 2026: Commercial Vehicle and Oilfield Corridor Crash Data. Weslaco, TX, September 1, 2026. https://fernandojlopez.com/reports/texas-truck-oilfield-crash-data-2026/
The crash figures come from the Texas Department of Transportation Crash Records Information System, calendar year 2025. The corridor groupings and the deaths-per-100-crashes metric are our own analysis and should be credited as such. The dataset is free to reuse with attribution.
Contact The Lopez Law Group
Reporters and researchers are welcome to the underlying county file, the corridor definitions or comment on Texas commercial vehicle and oilfield injury litigation.
Fernando J. Lopez, Attorney, The Lopez Law Group 2611 N Texas Blvd #1, Weslaco, TX 78599 Phone: (956) 968-7800 Email: [email protected] Interviews available in English and Spanish.
Reviewed by Fernando J. Lopez, Texas personal injury attorney, State Bar of Texas #24060186. Published September 1, 2026. Last updated September 1, 2026.
References
- Texas Department of Transportation, Commercial Motor Vehicle (CMV) Involved Crashes and Injuries by County, 2025. https://www.txdot.gov/content/dam/docs/division/trf/crash-records/2025/2025-cmv-involved-crashes-injuries-county.pdf
- Texas Department of Transportation, Crashes and Injuries by County, 2025. https://www.txdot.gov/content/dam/docs/division/trf/crash-records/2025/2025-crashes-injuries-county.pdf
- Texas Department of Transportation, Texas Motor Vehicle Traffic Crash Facts, Calendar Year 2025. https://www.txdot.gov/content/dam/docs/division/trf/crash-records/2025/2025-texas-motor-vehicle-traffic-crash-facts.pdf
- Commercial Vehicle Safety Alliance, 2025 International Roadcheck Results. https://cvsa.org/news/2025-roadcheck-results/
- Federal Motor Carrier Safety Administration, SAFER Company Snapshot. https://safer.fmcsa.dot.gov/CompanySnapshot.aspx
- Texas Civil Practice and Remedies Code § 16.003. https://statutes.capitol.texas.gov/Docs/CP/htm/CP.16.htm

